Are Waterloo Region average home prices really up 21 percent from 2016 to 2017, as The Record claims? A check of the data confirms this number, however like many things the devil is in the details. What does year over year last quarter home price appreciation in Waterloo Region look like in comparison?
Due to the Wynne Foreign Buyers Tax average prices in the region dropped quite strongly over the summer months of 2017 and only stabilized in the last 3rd of the year. On a year over year basis my gut was telling me straight away that the increases I’d seen weren’t even close to 21%, so what is going on with this news article?
TheRecord.com arrived at the 21% figure by using 24 months of data from January 2016 to December of 2017. While this is perfectly legitimate, it is a number that is also an artifact of very high 2017 spring prices and quite substantial appreciation month over month in 2016.
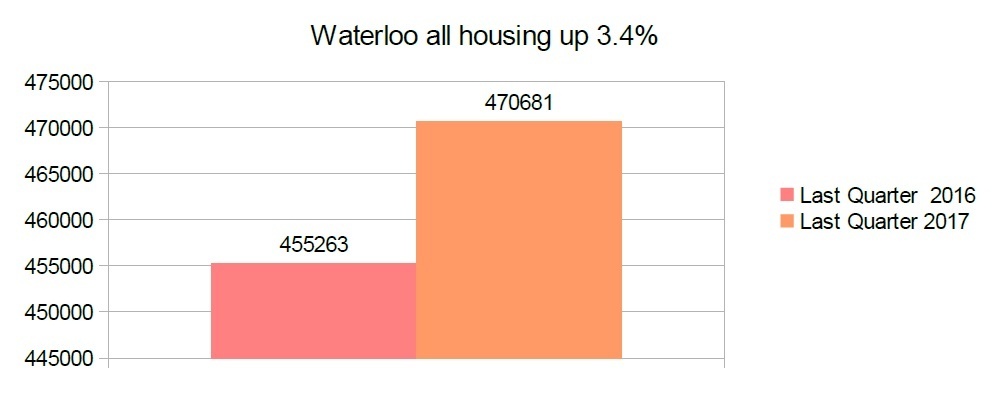
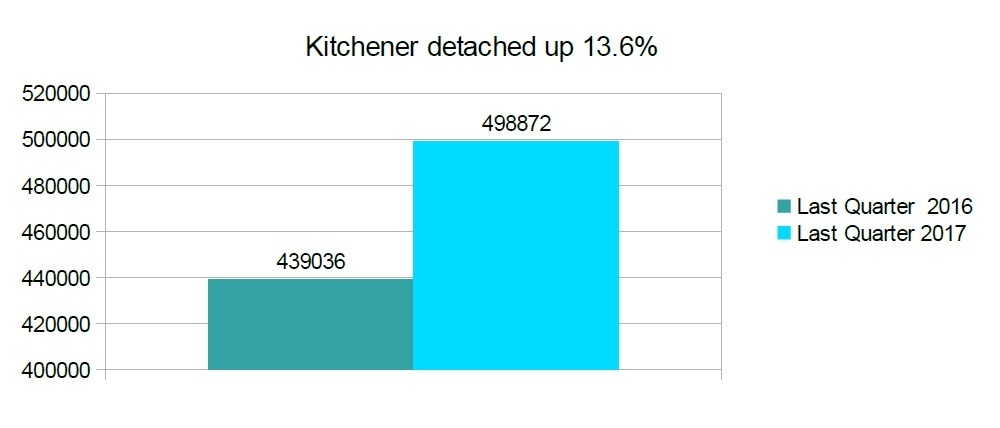
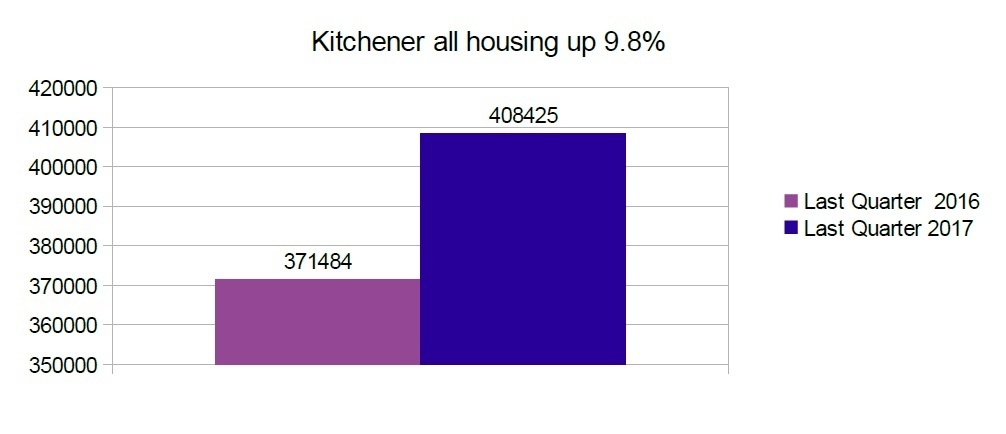
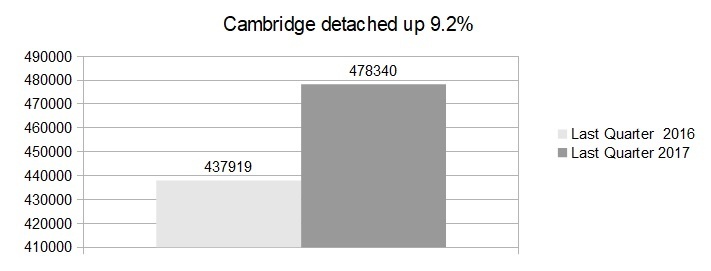
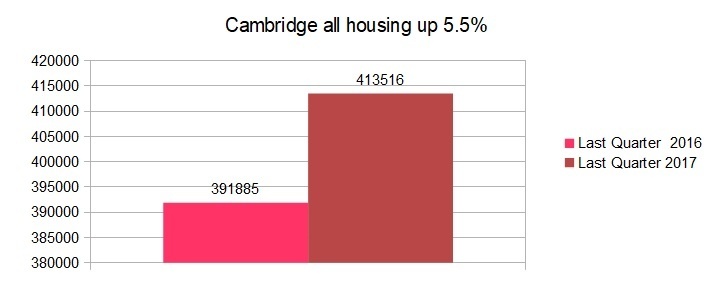
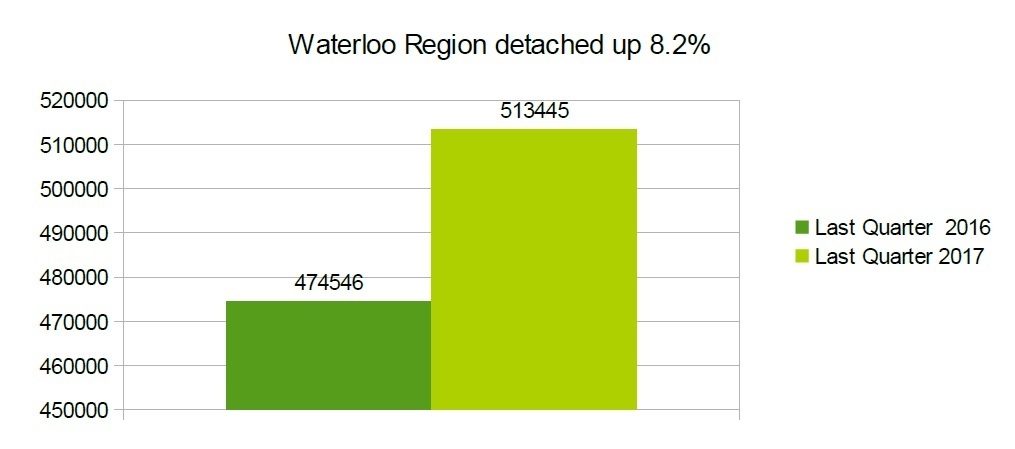
I decided to do an analysis of year over year last quarter home price appreciation in Waterloo Region using data from the last quarter of 2016 and the last quarter of 2017. This data set dampens the strong gains seen in 2016 and removes the huge run up in prices seen in the spring of 2017. While the numbers are still quite favourable they are nowhere near 21%.
Here are 8 charts comparing the last quarter of 2016 with 2017 for Waterloo Region, Cambridge, Waterloo and Kitchener: