
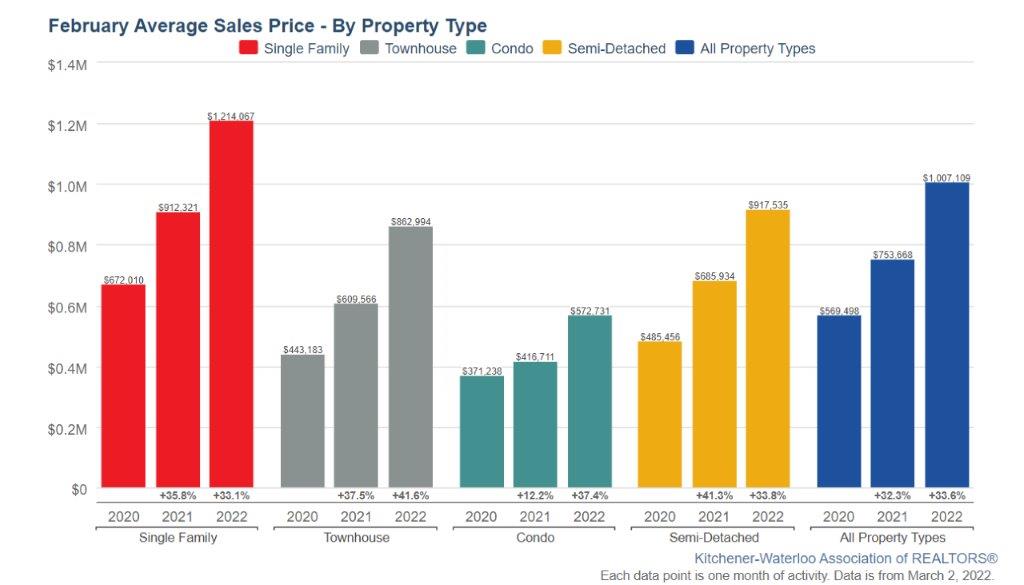

KWAR cautions that average sale price information can be useful in establishing long-term trends but should not be used as an indicator that specific properties have increased or decreased in value. The MLS®® Home Price Index (HPI) provides the best way to gauge price trends because averages are strongly distorted by changes in the mix of sales activity from one month to the next.

The MLS® HPI composite benchmark price for all residential properties in Kitchener-Waterloo was $974,600 in February. This represents a 36.8 per cent increase over February 2021 and a 5.4 per cent increase compared to January 2022.
- The benchmark price for a detached home was $1,090,000. This represents a 38.2 per cent increase from February 2021 and 5.0 per cent increase compared to January 2022.
- The benchmark price for an apartment-style condominium was $ 464,400. This represents a 33.8 per cent increase from February 2021 and a 6.1 per cent increase compared to January 2022.
- The benchmark price for a townhouse is $729,900. This represents a 41.9 per cent increase from February 2021 and a 7.0 per cent increase compared to January 2022.
“The low listing inventory is not because people are not selling their homes, in fact we saw a spurt in the number of new listings in February, said Bell. “With homebuying demand still going strong, competition remains high, and homes were snapped up quickly.”
There were 806 new listings added to the MLS® System in KW and area last month, an increase of 9.5 per cent compared to February of last year, and a 24.3 per cent increase compared to the previous ten-year average for February.
The total number of homes available for sale in active status at the end of February was 290, a decrease of 2.7 per cent compared to February of last year, and 70.3 per cent below the previous ten-year average of 975 listings for February.
The number of months of inventory nudged up to 0.5 months in February from 0.3 months in January. Inventory has been under the one-month mark since October 2020. The number of months of inventory represents how long it would take to sell off current inventories at the current rate of sales.
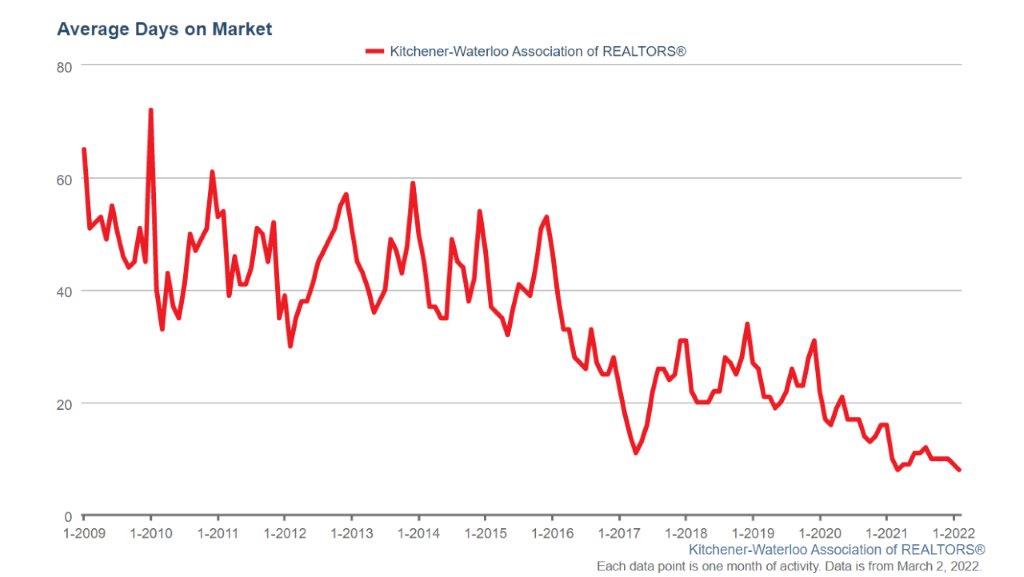
The average number of days to sell in February was 8 days, compared to 10 days in February 2021 and a previous 5-year average of 19 days.
Those requiring specific information on property values should contact a local REALTOR®. Working with a Realtor is the best way to get a complete picture of the property and community you are considering.
View our HPI tool here to learn more: https://kwar.ca/hpi-dashboard
KWAR cautions that average sale price information can be useful in establishing long-term trends but should not be used as an indicator that specific properties have increased or decreased in value. The average sale price is calculated based on the total dollar volume of all properties sold. Months Supply is the inventory of homes for sale at the end of a given month, divided by the average monthly closed sales from the last 12 months Those requiring specific information on property values should contact a local REALTOR®. REALTORS® have their fingers on the pulse of the market. They know the questions to ask, the areas to probe and what to look for so that you get a complete picture of the property and community you’re considering.