As a student of history in my earlier years, I was taught to learn from the past while living in the present. Housing prices and related data should be treated in the same way. My spring 2019 market update uses a 5 year history of sales volumes, prices and mortgage rates for the Waterloo Region market to shine light on current valuations.
Here in Waterloo Region spring is unfolding somewhat slower than normal due to the very nasty February and March we experienced. April hasn’t been a treat either but at least people are out looking at homes now.
Having said that we’ve nevertheless seen a fairly sharp run up in prices over the past few months. This isn’t atypical longer term and lies in the fact that no one wants to buy in the dead of winter or during the holidays.

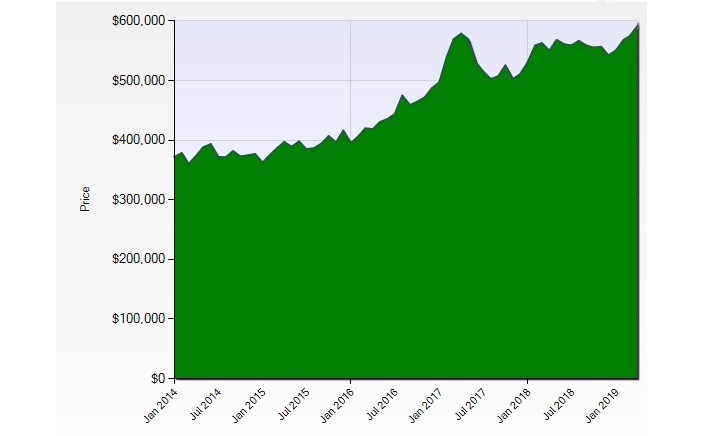
But prices are up considerably since 2014 as you can see from the graphs. They are currently almost 50% higher than the 2014 numbers. A detached homes is just under $600k compared to roughly $400k for a purchase in 2014. This rate of appreciation is well in excess of inflation, wage growth or even immigration numbers.
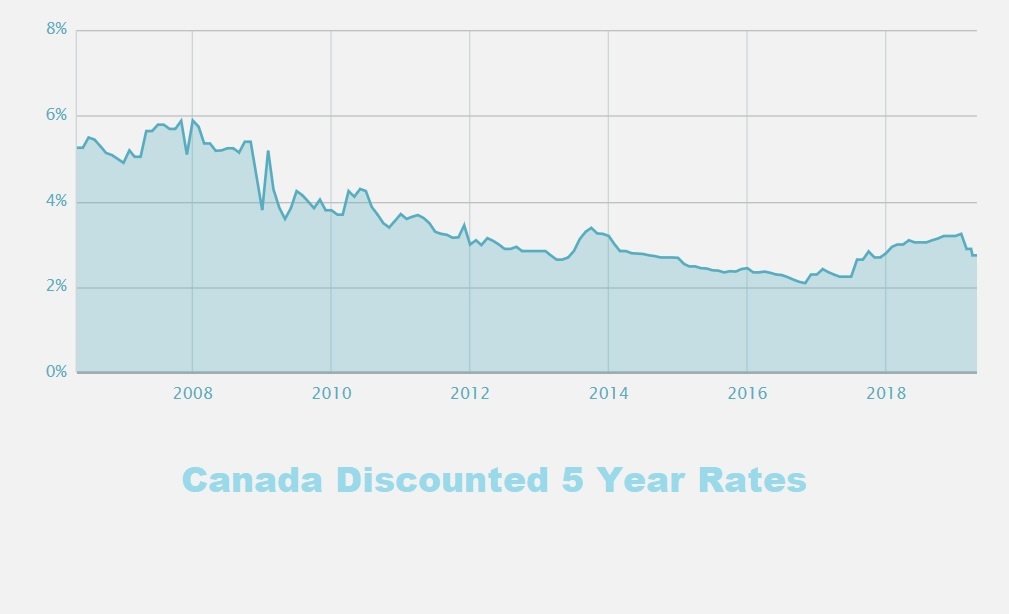
So what was the economic driver behind prices? A look back at mortgage rates over this time period sheds some light on this. Mortgage rates are closely tied to longer term bond rates and money has been dirt cheap since the the early 2000’s.
Investors searching out healthy returns will put capital to use wherever opportunity lies. Housing has been a great vehicle for capital accumulation over the past 20 years and the last few years have been spectacular for property investors.
Ordinary Canadians have piled into housing too and why wouldn’t they? Banks were almost giving money away in 2017 with rates into the very low twos on a five year fixed mortgage.
Add foreign buyers trying to get money out of their homelands and generational wealth transfer by parents helping their kids buy homes and you’ve got the perfect storm.
Going into 2014 discount rates (the actual rate lenders are offering, not the posted rate) were sitting at 3.19% and moved steadily downward almost a full point to 2.29% by early 2017.
In this low interest rate environment prices exploded, jumping 25% in 2016 alone. The frenzy continued into 2017, leading to the introduction of the Foreign Buyers Tax on April 20th, 2017.
Prices underwent a sharp correction but then resumed the march upward into the present day. It is clear that today’s somewhat higher rates are still not high enough to quell demand. The mortgage stress test rules of 2018 has also been a failure.
Bad monetary policy has played a huge role in the price run up we’ve seen. Rates should have risen in ’14, ’15 and ’16 instead of moving downward, and had they done so we wouldn’t be where we are today.
Toronto has seen the same run up in prices that we did and their buyers are now shopping here. Many buyers in the GTA are simply priced out of buying anywhere near Toronto. And our property is bargain basement cheap compared to Toronto and the GTA.

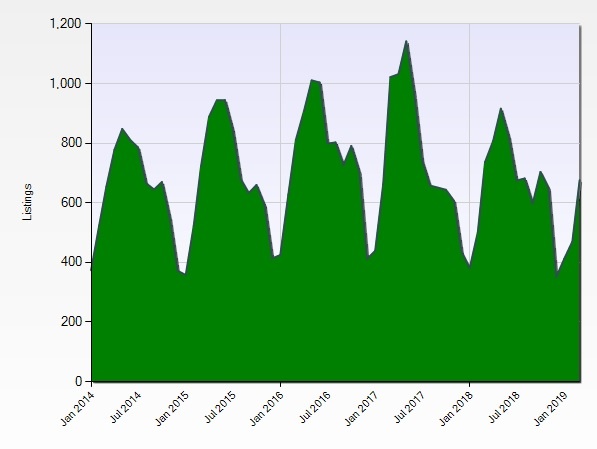
Sales volumes are down relative to 2017 but remain well within the norms for the preceding 5 years. The lower volumes are having little to no effect on prices it would seem. 2016 and ’17 volumes (and price gains) were anomalies and I don’t expect them to be repeated anytime soon. The graph shows this spike in volume but also shows the typical seasonal fluctuation seen every year.
There is nothing in our graphs that is negative. Normal enough volumes, rising prices, low rates and Toronto are all positive factors. Barring a bad recession, prices should remain flat or move upward going into the summer but I expect price growth to be moderate relative to earlier years. That’s the final word on my spring 2019 market update.


