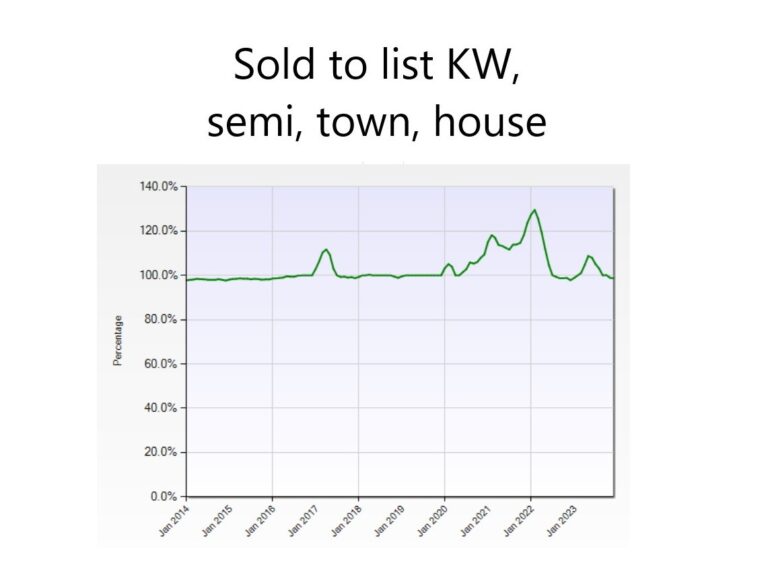
The sale to list ratio is one of the key indicators of real estate market activity. It’s a measure of how much a property sells for relative to the list price. Prior to 2017, here in Kitchener Waterloo, this figure usually sat in the high 90s. Over the last four years we saw sale to list ratios shoot up in early 2020 and rise almost nonstop before peaking at 130% in early 2022.
Aside from the low inventory volumes we’ve seen over the last decade, there are a couple of other factors at play affecting the high sale to list ratios we’ve seen; strong buyer demand and list price recommendations from listing agents.
Buyer demand relative to supply is ultimately what sets the final sale price regardless of list price, and also affects the sale to list ratio in both directions. A buyer’s perception of value, whether realistic or not, also determines what they are ultimately willing to pay. This perception played an out-sized role in the rapidly increasing sale to list ratio going into 2022.
The strategy of under-pricing
Recommendations to drastically under-price listings also contributed to a widening gap between list price and what properties were selling for. The intent of under-pricing a listing was to create stronger than normal interest from buyers looking for value. Initially this strategy provided a competitive advantage to any seller who chose to list low. But once the practice of under-pricing caught on widely, almost every buyer expected to pay a premium above the list price.
Sellers and their agents who priced listings at the expected sale price would have little to no interest in their offerings. A properly priced listing would be perceived to be over-priced (even when it’s not) when every buyer is expecting to pay 15 or 20% above asking.

The market has shifted
But under-pricing as a whole only works in a rising market with low supply and high demand. Our market has changed considerably over the past 20 months or so. Demand was sky high until they raised rates. The 130% sale to list ratio seen in Feb 2022 dropped to 100% by the summer and fell further, coming in at 98% in December. The ratio rose again during the busy spring selling season of 2023 but never exceeded 109%. Going into this year, the ratio is under 100% once more.
What does this mean for buyers and sellers?
Fundamentally, buyer perceptions have shifted. For the most part, huge premiums are a thing of the past. Nevertheless many agents and their seller clients are still under-pricing their listings and holding fixed offer dates. This has become a bit of a risky practice in some segments of the market place.
Under-pricing works best at the lower end of the market, particularly in newer subdivisions offering semis and town homes which are in high demand. It works less well for detached homes and especially so at the high end, as there simply aren’t enough buyers with deep pockets.
We are in a funny place because of the mixed messages about the market and the changing perceptions we are seeing. Sellers really need to think things out and have a serious conversation with their agents, backed by hard data. The sale to list ratio is definitely an important metric.
Our current market
I’ll share some anecdotes with you about pricing. I’ve got a few clients interested in towns and semis and I ended up visiting a several properties in Huron Park over the past few months. One I looked at was originally priced at $700k with a reduction to $600k when I viewed it. Looking at comps I’d have figured mid sevens because of a sale just a few weeks prior at $775k. It ended up going for $690k. Fast forward to just a week back and we saw another listed for $600K that sold for just over $660k and had 18 offers.
The first one I mentioned was considerably nicer and bigger and even backed onto bush and yet it went for a paltry $29 k more. There really was no comparison between the two. So what happened? Should it have been priced lower in the first place, at $600k instead of $700k? Probably, but there are other things to consider. The nicer one was listed in November when the market was winding down, unlike the recent sale in January when news of possible interest rate cuts was coming out.
I’ve been working with some higher end buyers for a few month now and we were only slightly above asking on a Laurelwood purchase we made. Another one (also in Laurelwood) that we we’d bid on earlier expired unsold. And a gorgeous property over in Kiwanis Park has been priced at anywhere between $999k and a million-five and it’s been on market for months. The higher priced stuff is not selling quickly, especially if the pricing is wrong. And there certainly aren’t many multiple offers. When there is it’s usually 1 or 2 other buyers and not 10.
Getting sound advice
If you’re looking to buy or you’ve got a property you’d like to list it’s clear that you’ll need to consider the changing sale to list ratios we’ve seen in Kitchener Waterloo. If you’re listing you’ll need to be well informed about the sale to list ratio in your segment and make a decision on where you’d like to price your sale. If you’re buying there will certainly be a sense of relief in knowing that our market has returned to relative normalcy. While sale to list ratios are a lagging indicator of market activity the ratios are almost real time with prices posted as soon as a sale moves to firm or pending status..


